
Stephen J. Morgan
EMAT 6680
Assignment #11
Assignment #11 Prompt:
Assignment #11 Solution:
For this investigation I started off by looking at the following polar equation:
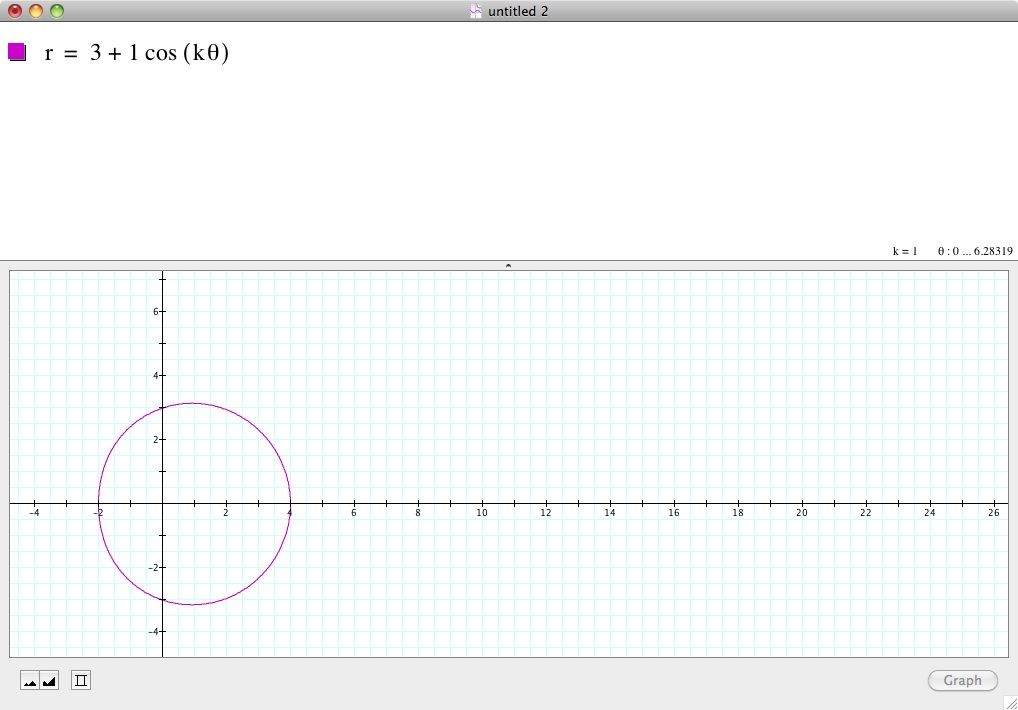
First, I graphed the equation where a, b, and k all had the value of 1. The picture of the graph can be seen below:
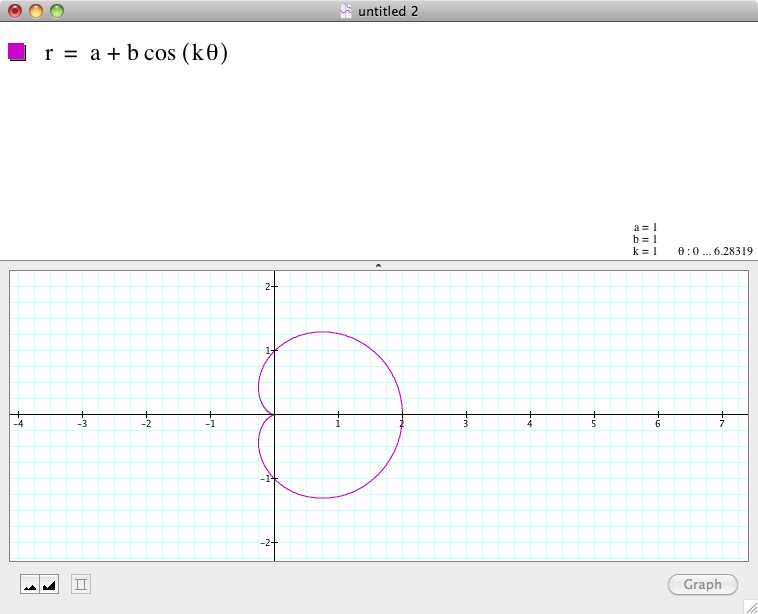
The graph above appears to be a picture of a heart or pear rotated 90 degrees counter clockwise. The figure does not appear to be of much interest. However, we can see that the radius of the circular-shaped figure is 1, the same value as k.
This led me to wonder what would happen if we graphed other polar equations where we kept the values of b, and k fixed at 1, but increased the value of a respectively. Below are a series of graphs illustrating this general premise:
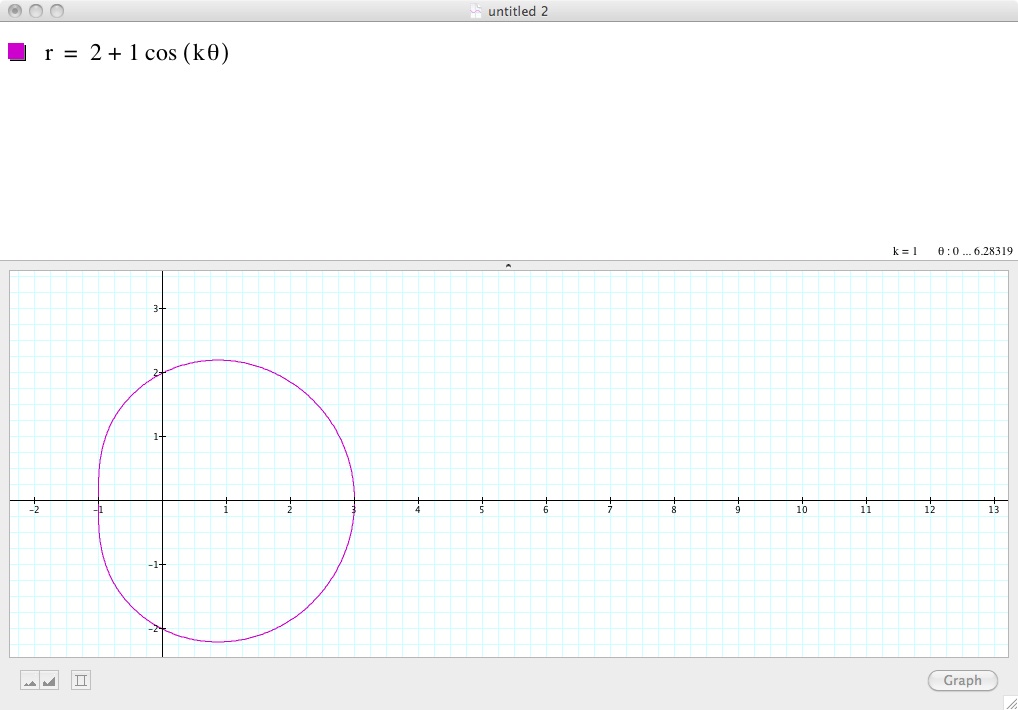
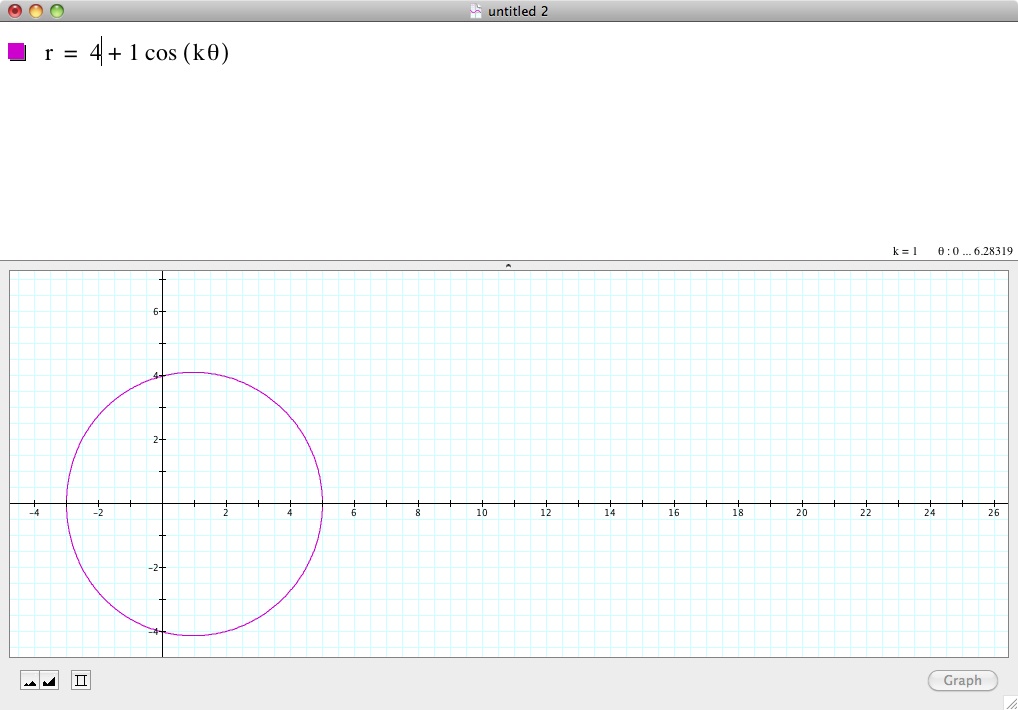
We can see several things of note. For one, the larger a becomes with respect to b, and k, the more circular our graph appears. We can definately see that when a=4, the graph appears much more circular then when a=2. Secondly, we can
observe that the circular objects in question have a radius equal to a. It is of note that the circle crosses through the points (-a+b, 0) and (a+b, 0). This led me to wonder if a similiar relationship would exist if we replace cos with sin in our
polar equation. Below is the same graph, except for the sin function:
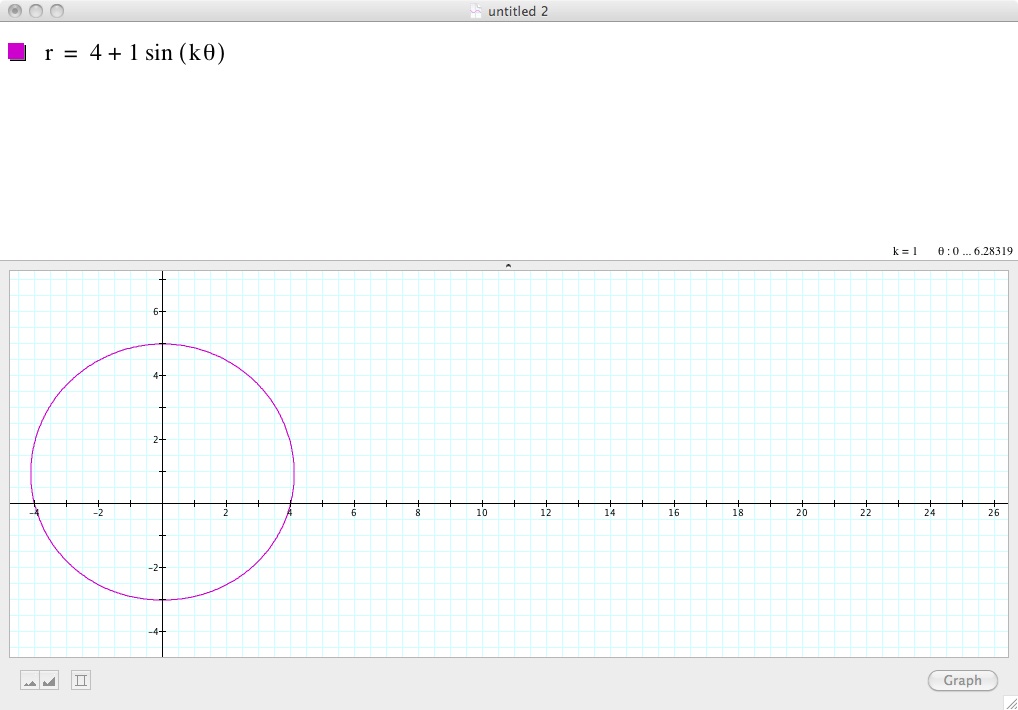
When we compare this graph to the cos one above, we can notice many similiarites. Predictably, the radius of the circular figure is also 4, which is the value of a. Additionally, we can see that there is a similiar pattern with intercepts. Now
instead of the x-axis, we can see that there will be two points the circular figure will intersect on the y-axis, (0, -a+b) and (0, a+b). Besides these differences and the orientations of the figures, the graphs seem to be similiar in nature.
In summary, the general observation here is that when b, k=1 and a>b and a whole number, for the sin and cos function we generate circular figures with radius=a. As a increases, the figures appear to be more circular in
nature. For the sin function two points on the circle will be (0, -a+b) and (0, a+b). For the cos function two points on the circle will be (-a+b, 0) and (a+b, 0).
Next I was curious to see what happened when we fix the values of a and b at one and increase the value of k. Below are several graphs showing this:
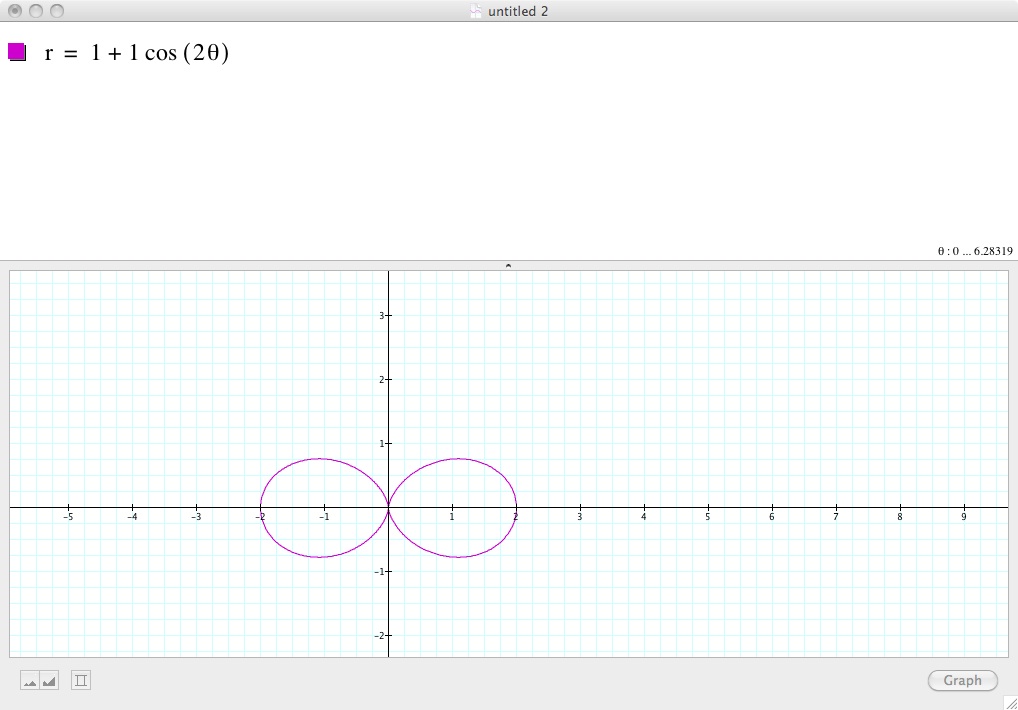
In summary, for where a=1, b=1 and k>1 we generate a figure with k-pedals. Additionally, each pedal has a radius of b.
The next thing I decided to examine was the polar equation where a<b. Below are several graphs:
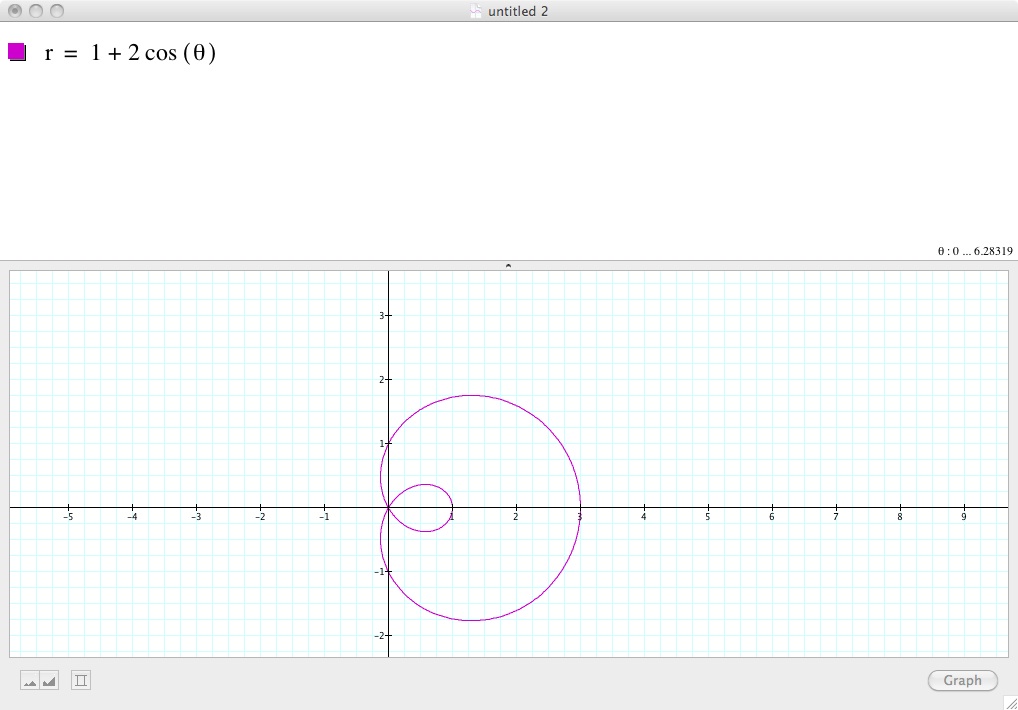
In the first graph a=1, b=2, and k=1. Here we see a peach-shaped like figure. However inside a semi-circular like figure is inscribed with radius=1/2.
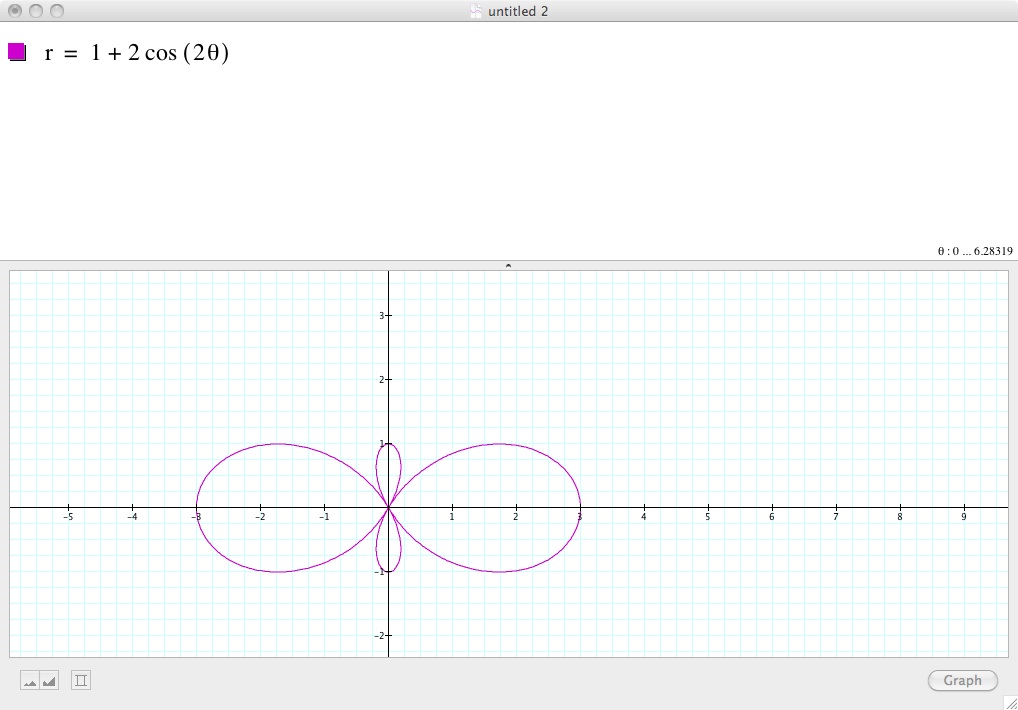
In the next graph the only thing that changes is that k=2 instead of 1. Notice, that it looks like we have two large petals facing horizontially and two smaller ones facing vertically.
The horizontial petals have a diameter of 3 and the vertical petals have a diameter of 1. The smaller petals appear to have a diameter of 1 or a and the larger petals appear to have a radius of 3.
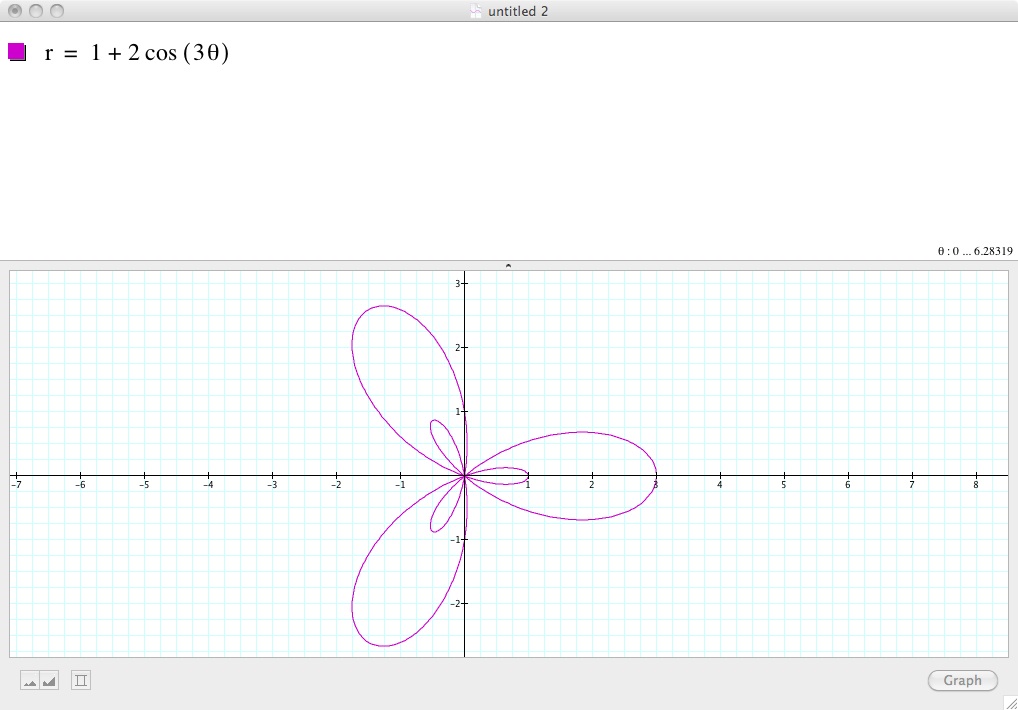
In this graph, we once again change the value of k, this time from 2 to 3. Now it appears like we have 2 cycles of 3 petals. The horizontial petals have a diameter of 3 and the vertical petals have a diameter of 1.
The smaller petals appearto have a diameter of 1 or a and the larger petals appear to have a radius of 3. From here it looks like we can make some general assumptions...but lets see one more graph.
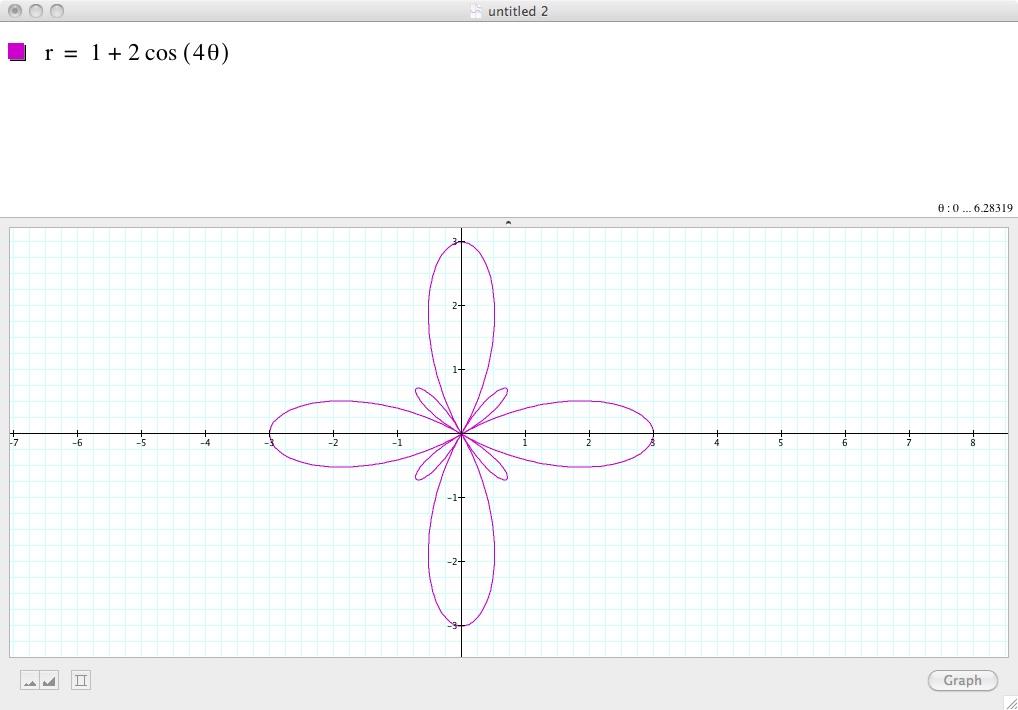
Lastly, we increase the value of k to 4. Here we see that there are two groups of 4 petals. The small petals again have a diameter of 1 and the large petals have a diameter of 3.
From this it seems we can make the following generalization:
For r= a+b cos (k*theta) or r= a+b sin (k*theta) the following appears to be true when a<b and both a and b are not 0:
1.) There are two groups of k petals
2.) If k is an odd number the smaller petals are inscribed in the figure. If not, they appear outside the figure.
3.) The radius of the smaller petals appears to be 1/2 a. The radius of the larger petals appears to be (a+b)/2.
Next I decided I wanted to explore what would happen if we let a=2, b=1 and increase k. Refer to the graphs below:
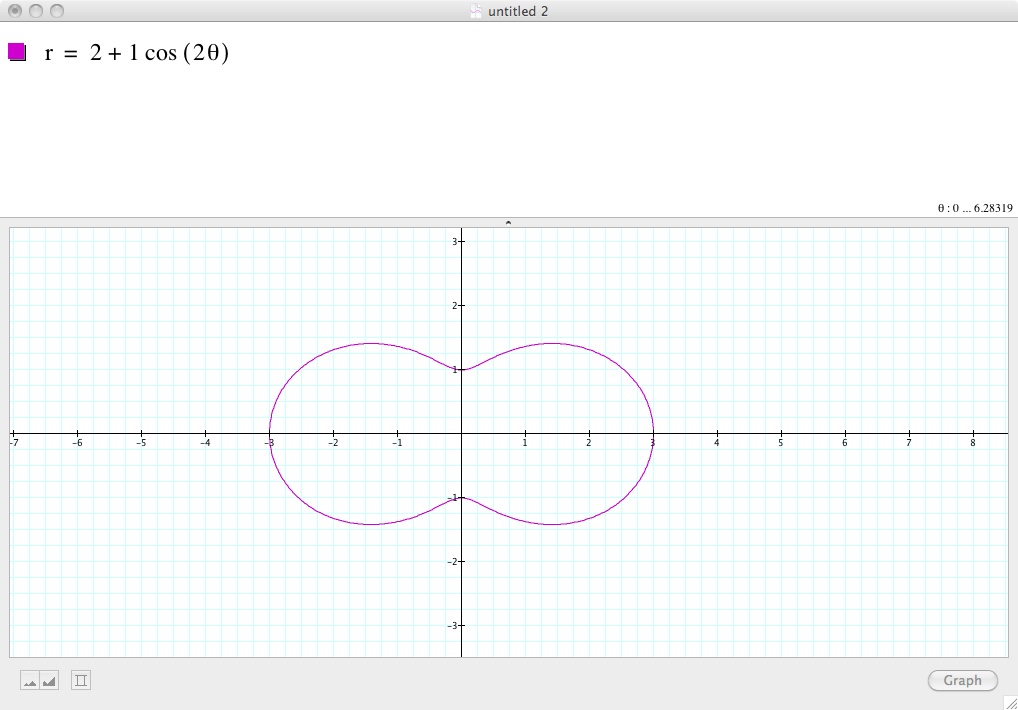
The first graph has a=2, b=1, and k=2. Here it looks like we almost have two circles intersecting. Each of these circles seem to have an approximate diameter of 3.
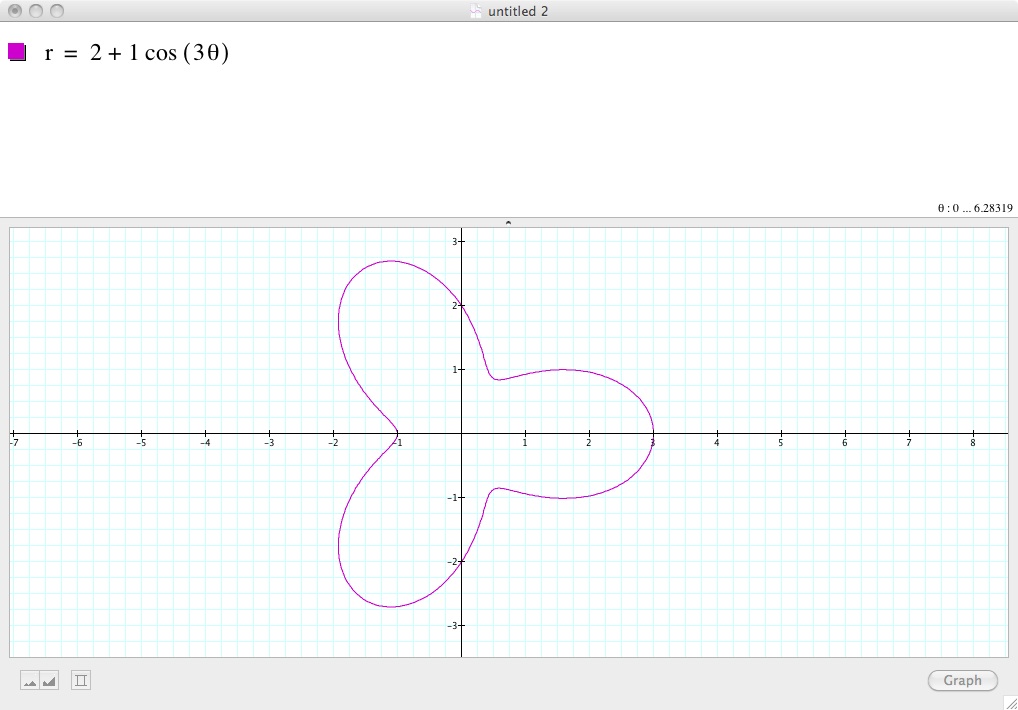
In this graph the only thing changed is the value of k. Here k=3. Here we have a 3-petal shaped figure. Each petal appears to have a diameter of 3, once again.
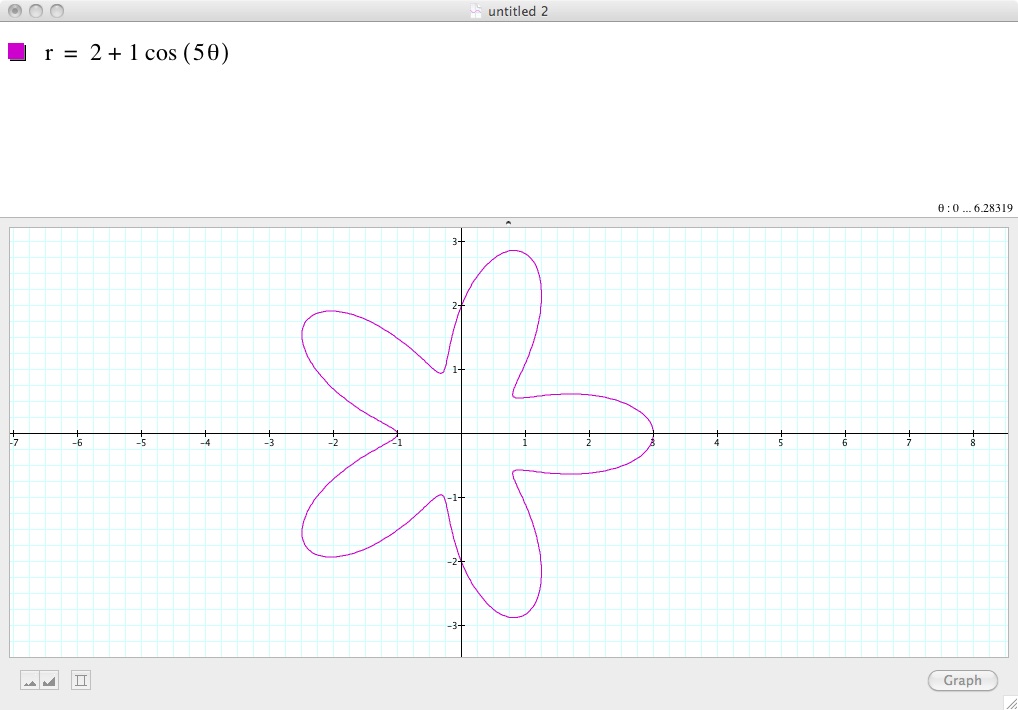
Lastly, here is a graph where k=5. There are 5 petals and each seems to have a diameter of 3. Thus I am led to make the following generalizations:
For r= 2+1 cos (k*theata):
1.) k is the number of petals
2.) the radius of each petal is a+b/2 or 1.5
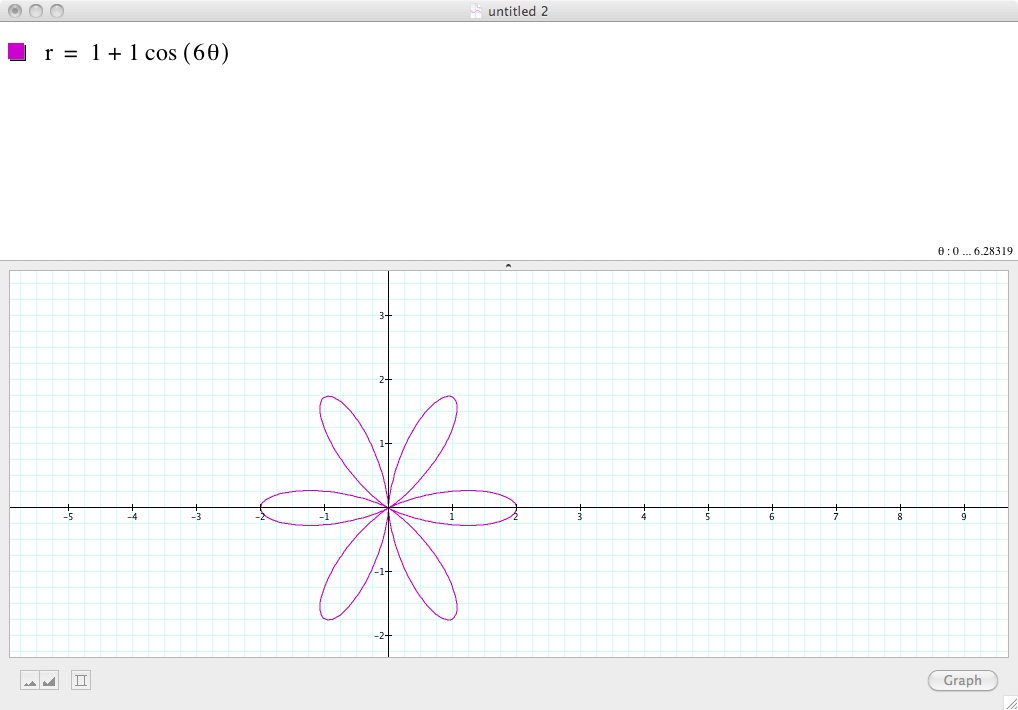
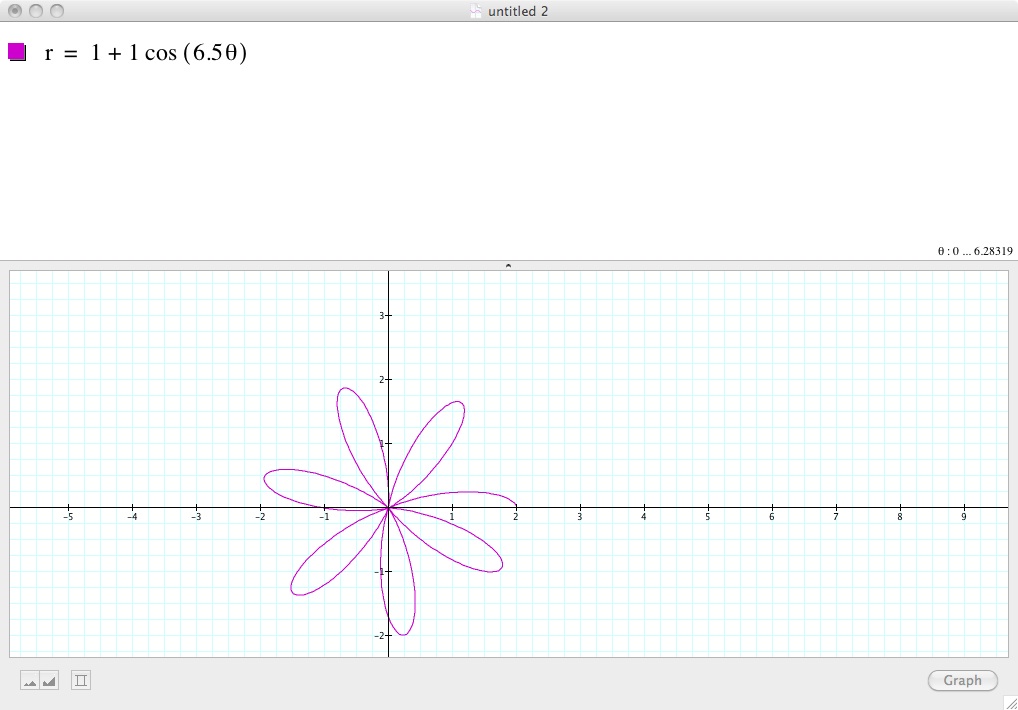
From this I was curious to see what would happen for the cosine function if a=0, b=1 and we increase k.
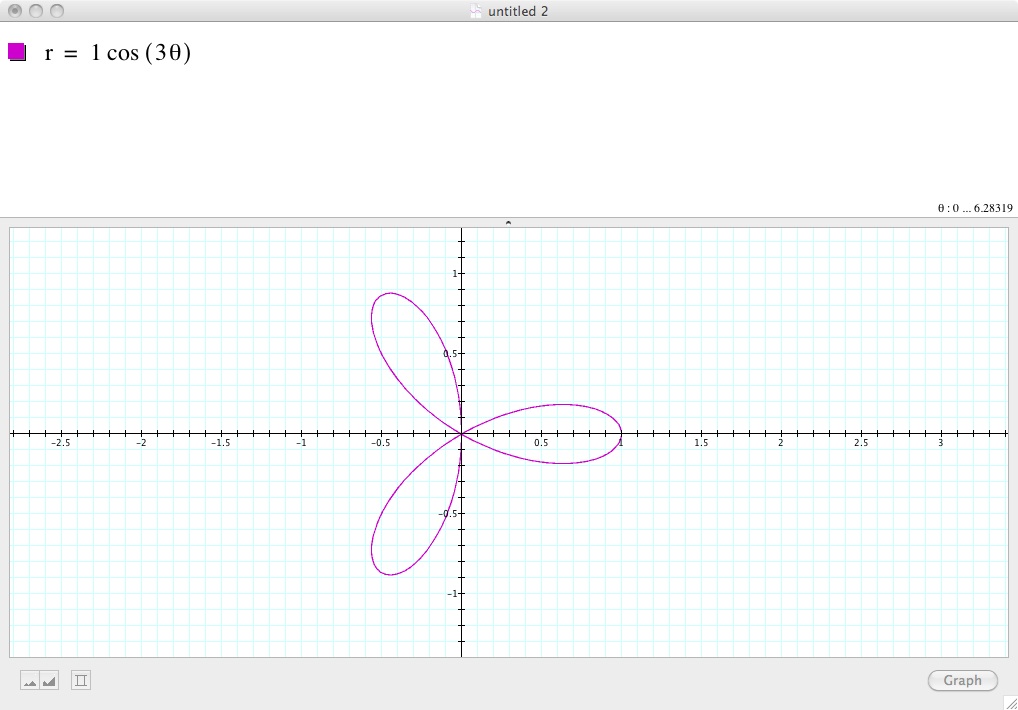
In this graph a=0, b=1, and k=3. The graph appears to generate a 3-petal shapped figure with petals of radius 1/2 or b/2.
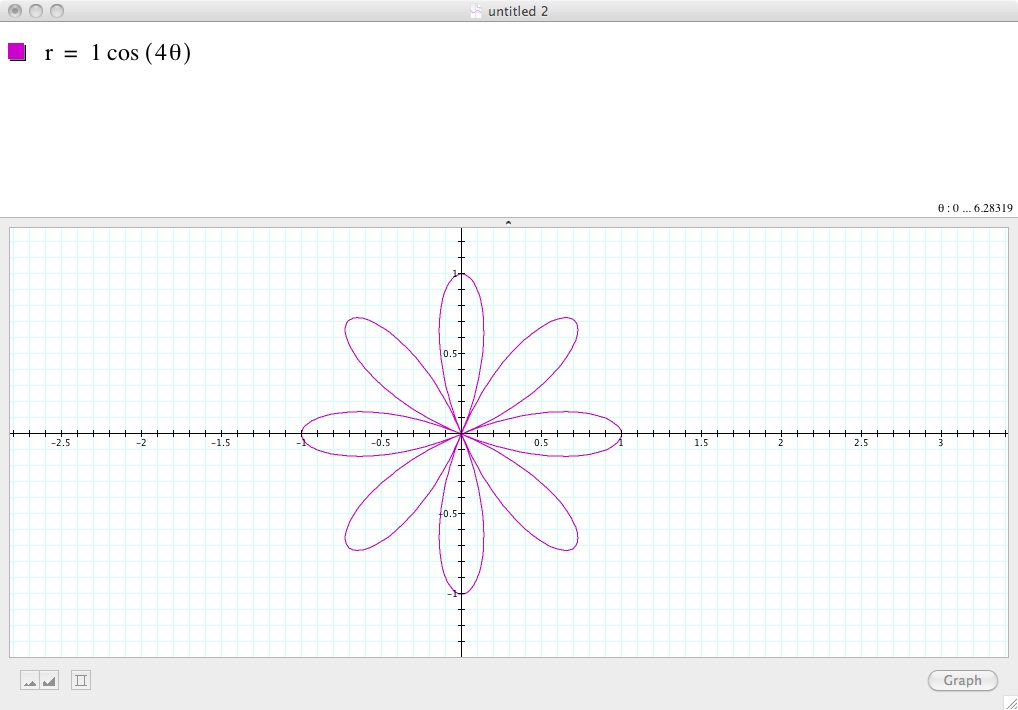
Here a=0, b=1, and k=4. We generate an 8-petal shaped figure with petals of radius 1/2 or b/2.
Thus:
1.) if k is odd, it represents the number of petals
2.) if k is even, then 2k represents the number of petals
3.) the radius of each petal is b/2 or 1
I was curious to see what would happen if we did the same for the sin function.
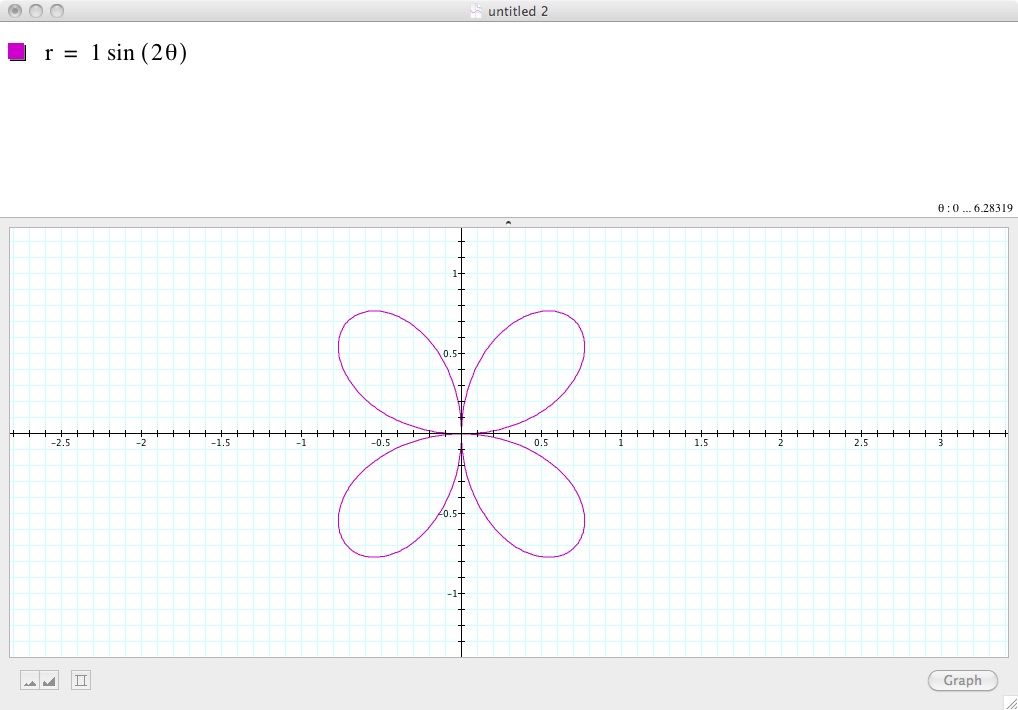
In the first graph, a=0, b=1, and k=4. Here we have 4 petals, also of diameter 1.
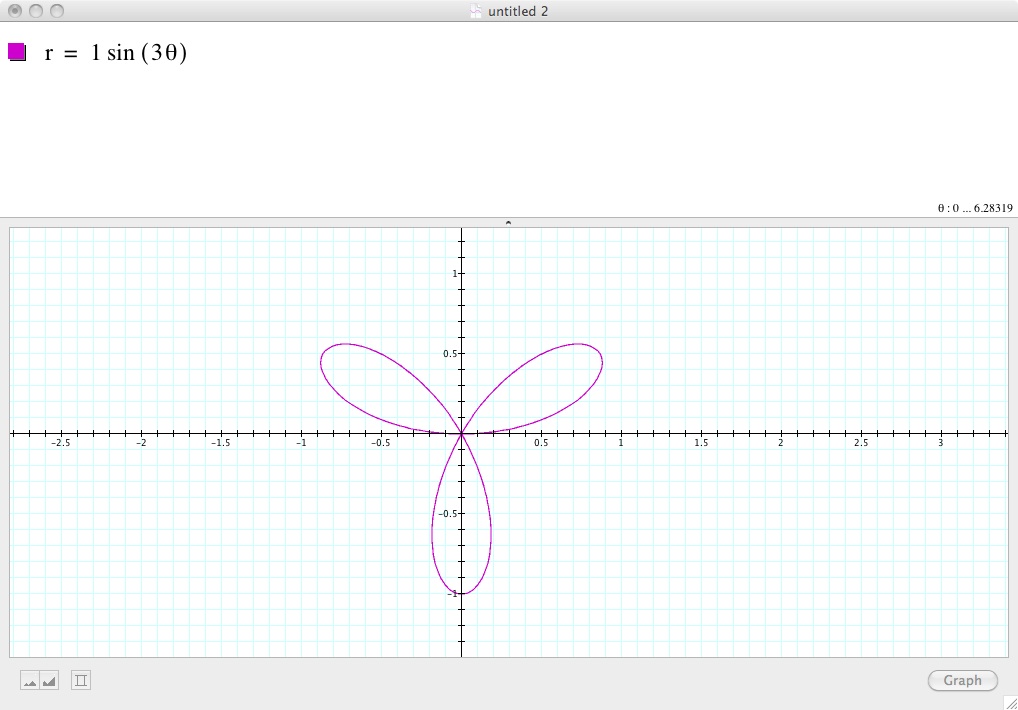
Here is a graph for a=0, b=1, and k=3. Predictably we have three petals of diameter 1.
Thus:
1.) k is the number of petals the figure has
2.) the diameter of eah petal is b
Lastly I was curious to see what happened if we took these functions and increased b. So I graphed the sin and cos graphs where a=0 b=2 and k=3.
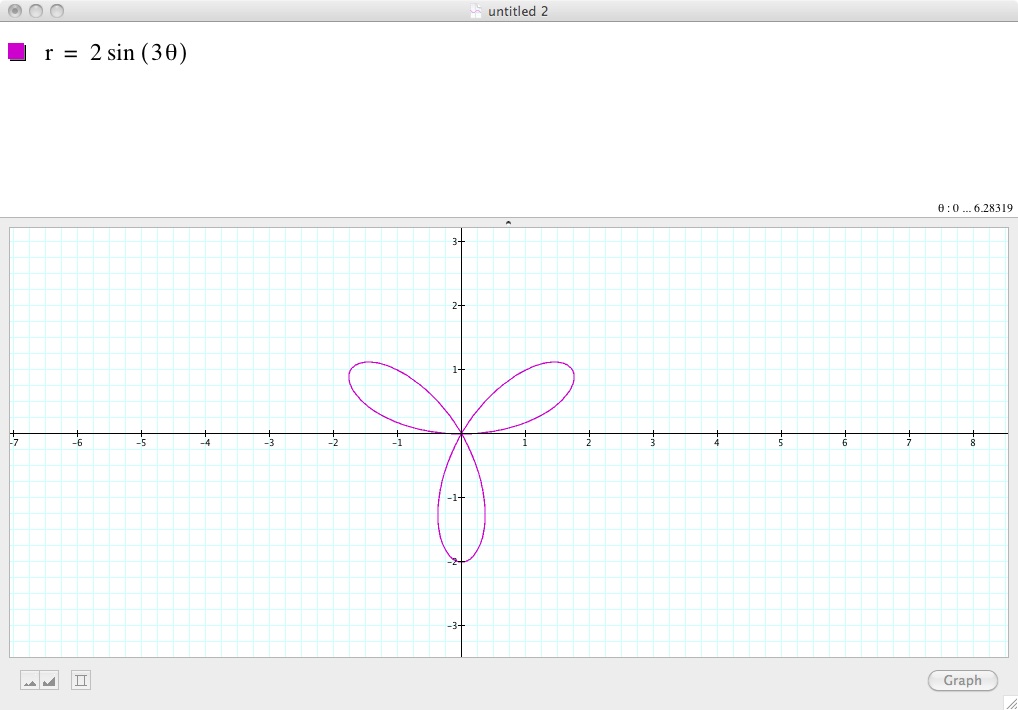
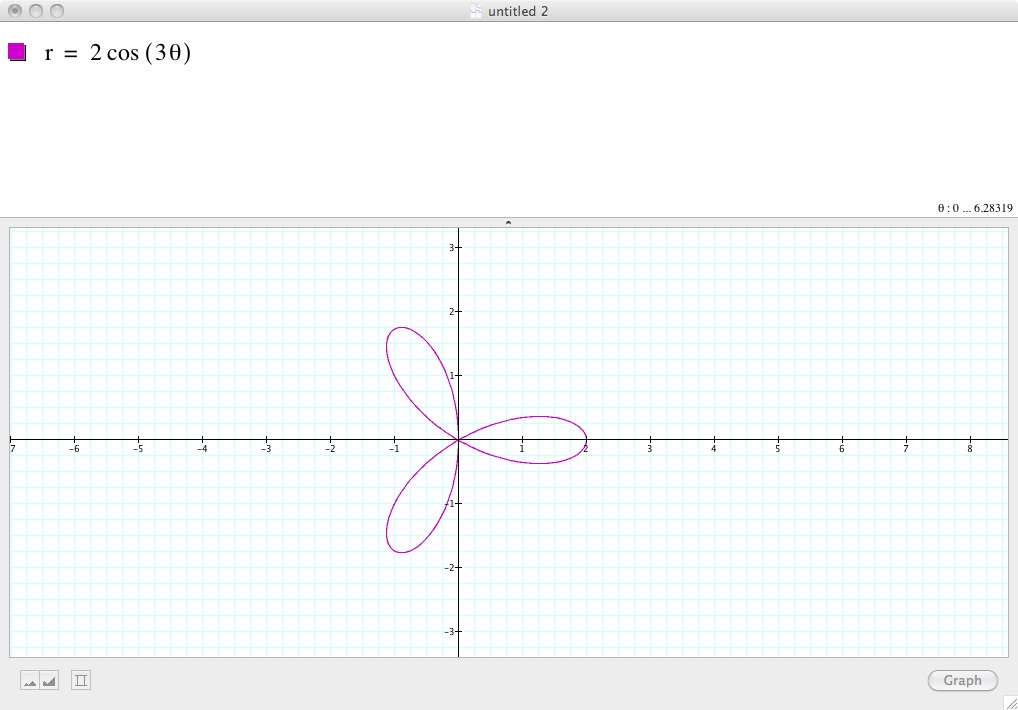
In both of these graphs the only difference was that the diameter of the petals was 2 instead of 1, confirming my speculation that the diameters of the petals were dependant on b.
This concludes my investigation.